Your CFO just asked: "Why do we need another event coordinator?"
It's a fair question. Your event portfolio is growing. Your team is stretched thin. The knee-jerk answer is to add headcount.
But before you submit that hiring requisition, let's run the numbers on what you're actually buying—and whether there's a more innovative way to scale.
This isn't about replacing people. It's about whether your organization should invest $115,000+ per year in human labor for tasks that technology can handle for a fraction of the cost.
The Strategic Question
As an event leader, you're facing a resource allocation decision:
Option 1: Add $115,000+ in permanent overhead (salary + benefits + management) Option 2: Invest in technology that scales your existing team's capacity Option 3: Continue operating at unsustainable capacity (not really an option)
Your CFO, COO, and board want to see the return on investment. Let's give them the data.
What a Full-Time Event Hire Actually Costs Your Organization
Beyond the Offer Letter
When your HR team presents a $65,000 salary for an event coordinator, that's just the starting point. Here's the whole financial picture:
Base Salary: $65,000
Mandatory Benefits & Taxes (37.65%): $24,473
Payroll taxes (FICA): $4,973
Health insurance (employer portion): $12,000
Benefits package: $7,500
Source: U.S. Bureau of Labor Statistics, Employer Costs for Employee Compensation, December 2023; benefits average 29.6% of total compensation, with healthcare costs from Kaiser Family Foundation 2023 Employer Health Benefits Survey showing average single coverage at $8,435, family at $23,968
Additional Operational Costs: $13,100
401(k) match (4%): $2,600
Professional development: $3,000
Equipment & software: $2,500
Office overhead allocation: $5,000
Source: Society for Human Resource Management (SHRM) 2023 Employee Benefits Survey; training costs average $1,000-3,000 annually per employee
Productivity ramp (25% reduction in Q1 value): $12,000
Source: SHRM 2023 Talent Acquisition Benchmarking Report; average cost-per-hire is $4,700; Brandon Hall Group research shows new hires take 3-6 months to reach full productivity
Zero turnover (event industry averages 30.8% annually)
No raises or merit increases
No additional team growth needs
Source: Work Institute 2024 Retention Report; hospitality and events sector turnover rate of 30.8%; SHRM estimates replacement costs at 50-200% of annual salary for specialized roles
What Are You Actually Buying?
Let's break down how a typical event team member allocates their 2,080 annual work hours:
Administrative Operations (60% = 1,248 hours):
Data management and spreadsheet maintenance
Email coordination and follow-ups
Schedule creation and conflict resolution
Document collection and organization
Status tracking and manual reminders
Form processing and data entry
Strategic Initiatives (25% = 520 hours):
Content strategy and curation
Stakeholder relationship management
Problem-solving and decision-making
Program design and innovation
Meetings & Coordination (15% = 312 hours):
Internal team meetings
Speaker/vendor calls
Cross-functional collaboration
Source: SessionBoard internal analysis of 700+ customer implementations, 2022-2024 time-motion studies; corroborated by Professional Convention Management Association (PCMA) "Event Professional Career & Salary Survey" 2023
The $73,000 Question
At a fully-loaded cost of $122,000 in year one, your organization is paying:
$97 per hour for all work
$58,000+ annually for administrative tasks that are highly automatable
Source: McKinsey Global Institute, "A Future That Works: Automation, Employment, and Productivity," 2023; estimates 60-70% of administrative and coordination tasks are automatable with current technology
Strategic implication: You're investing premium human capital in commodity administrative work.
The Alternative Investment Model
Technology as a Capacity Multiplier
Event management platforms automate the 60% of work that doesn't require human judgment:
What Technology Handles:
Automated data collection (forms, portals, integrations)
Workflow automation (reminders, status updates, notifications)
Communication logistics (bulk messaging, targeted campaigns)
Real-time tracking and reporting
What Humans Continue to Own:
Strategic content decisions
Relationship development and management
Creative problem-solving
High-stakes negotiations
Crisis management and on-site execution
The Capacity Economics
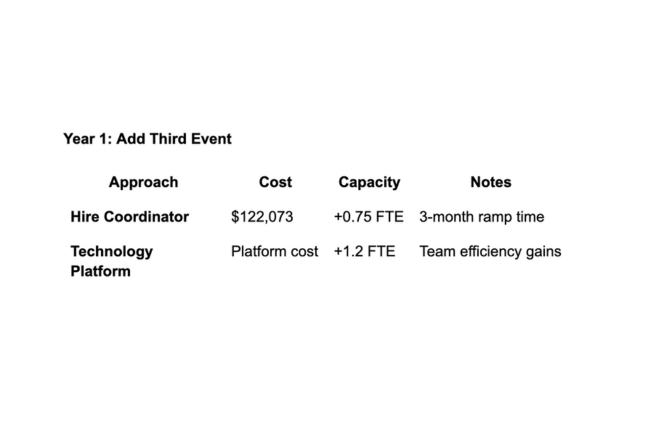
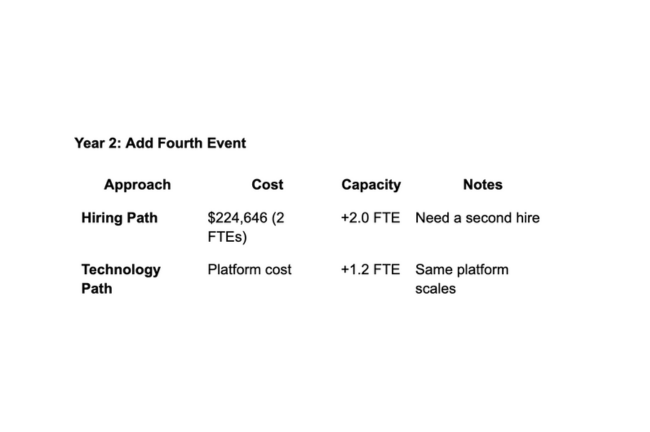
Scenario: Your 2-person event team needs more capacity to scale from 2 to 4 events annually.
Traditional Hiring Model:
Add 1 FTE: $122,000 (Year 1)
Capacity gained: ~0.75 FTE effective (due to ramp time)
Management overhead: +15% for supervision
Cost per unit of capacity: $162,667
Technology Investment Model:
Platform implementation: Fraction of hiring cost
Capacity unlocked: 60% of 2 FTE = 1.2 FTE worth of work
Management overhead: Zero (software doesn't need supervision)
Cost per unit of capacity: Significantly lower
Additional strategic value: Your senior team members can now focus on high-value strategic work rather than administrative tasks.
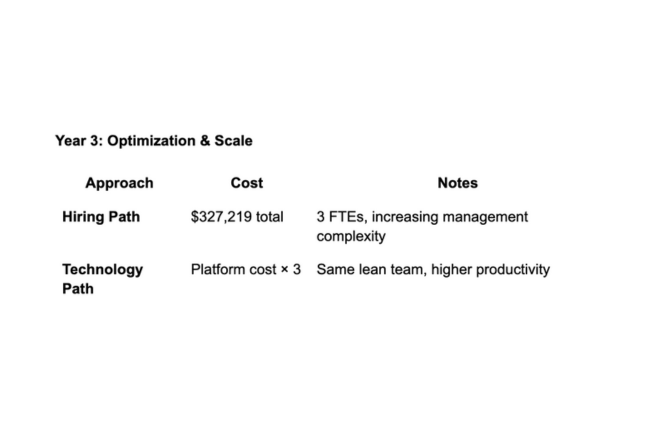
Three-Year Total Cost of Ownership Analysis
Scenario: Scaling Event Operations
Cost Differential by Year 3: $200,000-300,000+
Calculation based on $102,573 annual fully-loaded cost per employee after year one, excluding potential raises, additional benefits expansion, or management overhead increases
Risk-Adjusted ROI Analysis
Hiring Path: Risk Factors
Turnover Risk (30.8% annually):
Probability of losing one hire within 18 months: 42%
Replacement cost: $51,000-102,000 per position
Institutional knowledge loss: Difficult to quantify but significant
Source: Work Institute 2024 Retention Report; SHRM replacement cost estimates
Scalability Risk:
Each additional event requires proportional headcount
Linear cost growth with linear output growth
Management overhead increases with team size
Productivity Risk:
Administrative work expands to fill available time (Parkinson's Law)
No built-in efficiency improvements
Quality is dependent on individual performance
Technology Path: Risk Factors
Implementation Risk:
1-2 month setup and training period
Change management requirements
Initial productivity dip during transition
Adoption Risk:
Team resistance to new processes
Learning curve (typically 2-4 weeks to proficiency)
Requires process documentation and standardization
Risk-Adjusted Expected Value
Hiring Path 3-Year Expected Cost:
Base cost: $327,219
Turnover probability (42%): $51,000
Total expected investment: $378,000+
Technology Path 3-Year Expected Cost:
Platform cost over 3 years
Implementation support
Total expected investment: Significantly lower with lower variance
Risk analysis uses standard expected value calculation: (Probability × Impact) for each risk factor
Strategic ROI Beyond Cost Savings
What Gets Unlocked When You Automate Administration
When your senior event professionals reclaim 1,200+ hours annually from administrative work, here's what becomes possible:
Ready to see how the numbers stack up for your team?
Stop managing your event content through spreadsheets and scattered email threads. Schedule a personalized demo to see how Sessionboard eliminates manual administrative work and gives your team the capacity to scale.

.png)